World Wide Data Day 2019 - Archive


World Wide Data Day 2019: Wednesday, 16 October, 00:00-23:59 UTC
Small URL for this page: http://tiny.cc/w2d2.
Registration is closed for 2019. To request further information, please send an e-mail.
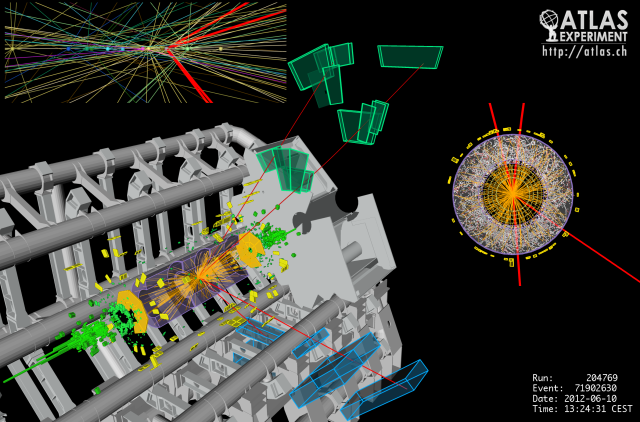
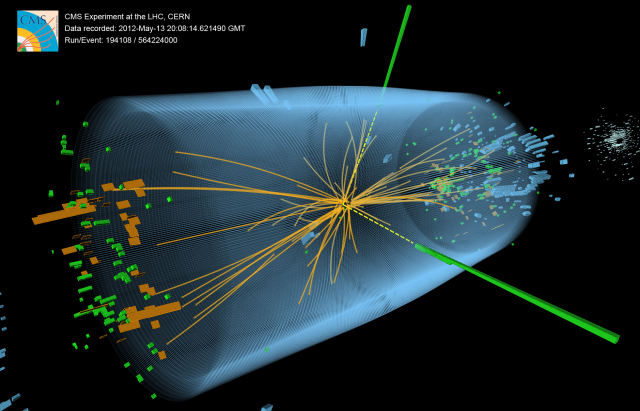
LHC World Wide Data Day is a 24-hour span, midnight-to-midnight UTC, in which students from around the world can analyze data from the Large Hadron Collider and share results via an ongoing, 24 hour videoconference with physicist moderators taking shifts in locations around the world.
Who is eligible:
LHC-W2D2 is open to groups of 4 or more high school students who have the aptitude and interest to analyze data from the Large Hadron Collider. We encourage but do not require each group to work with a sponsoring teacher. Groups of university undergraduate (or equivalent) students may also participate. It helps to have studied physics but it is not required. Registration is now closed. Please consider joining us in 2020. Of course, any class can do the measurement on their own at any time.
What happens:
On or before the date above, groups will meet to analyze data using one of the recommended measurements below. All analyses will be of open, public data from the Large Hadron Collider. After data analysis, each group uploads its results at least 30 minutes before the pre-assigned time of their videoconference. Videoconferences are on Vidyo; they are up to 30 minutes long and consist of up to 5 groups plus moderators. Each group has 3 minutes to present results. If there is open time after the presentations and question period, students may stay to chat with the moderators and each other.
Get the information and the materials you need
Recommended LHC measurements:
Resources:
- Intro slides
- Tally sheet
- Practice spreadsheet (sandbox)
- Results spreadsheet 2018 ← view results of W2D2-18 measurement!
- Results spreadsheet 2019 ← enter data here; be sure to read teacher instructions for ATLAS or CMS first
- About detector geometry
- Teacher notes
Messages for group leaders from W2D2 Coordination:
- Memo 0, Tue 16 Sep 2019
- Memo 1, Tue 24 Sep 2019
- Memo 2, Wed 02 Oct 2019
- Memo 3, Mon 07 Oct 2019 (supplement, Thu 10 Oct)
- Memo 4, Mon 14 Oct 2019
Learn more about the LHC, the detectors, and the physics
Reading materials:
- Large Hadron Collider (CERN page)
- ATLAS website
- CMS website
- Geometry of a collider detector (QuarkNet page)
Videos:
- CERN in 3 Minutes
- LHC: The Large Hadron Collider (Don Lincoln)
- The Standard Model (Don Lincoln)
Get the word out
- Download the flyer for students.
- Download the press release.
- Visit @physicsIMC.
- Have students tweet W2D2 with hashtag #LHCIMC. You can too!
Introduction
In this measurement, students find the directional distribution of muon track in ATLAS. They are searching for:
- anomalies in the distribution that might indicate a bias in the detector or in the data
- clues to how particles that result from collisions behave in ATLAS and the LHC.
Students should be divided into small groups. Each group should have a tally sheet. They should study the sheet before beginning.
Student Procedure
- Work with a partner teams of two are best for this measurement.
- Open HYPATIA-w2d2 (main domain link) (alternative domain link) and find the data. View the screencast for help.
- Choose the dataset assigned by your teacher. If you do not have a teacher or a physicist working with you, e-mail us for assistance choosing a dataset - the sooner the better.
- Advance through the events, only stopping for dimuons. Dimuon events have two long tracks that pass into to blue muon chambers in one or both of the two views. All else is treated as background.
- For each dimuon event, look at each muon track in the forward (x-y) view on the left and measure angle PHI from the +x axis (horizontal axis, right side) on the left, end-view image. PHI runs all the way around the beamline (z axis) from 0 to 360 degrees. Then switch to the side (y-z) view on the right and measure angle THETA in the same way for each muon track. THETA runs from 0 to 180 degrees either clockwise or anti-clockwise from the +z axis, whichever is the shortest path to the track. Note that you will need a protractor to make the measurement and that you should be careful to measure the angle in x-y from the tangent to the curvature of the track closest to the vertex or center of the event. (There is another way but it requires some manipulation and calculation.)
- Place tick marks for each angle measured in the tally sheet, using the closest values that appear in the sheet. (For example, 17 degrees is closest to 10 and 23 degrees is closest to 30.) This will allow us to record numbers of events in bins representing 20 degree intervals.
- When you are finished with your dataset, add up the number of tick marks in each bin of PHI and each bin of THETA and make a histogram of each on the second page (or reverse side) of your tally sheet sheet,
- Prepare to report your results to the class.
Teacher Procedure:
- Before you start, Open the W2D2 Report (Google) Spreadsheet and go to the ATLAS tab. Read the warnings!
- Look at the datasets other school groups have already selected for their measurements in column D. While some overlpa may be inevitable, try to select datasets for your students that are as little used as possible.
- Help students as they work from the Student Procedure above.
- As they finish, they should add their numbers to classroom histograms of PHI and THETA.
- Record the same final numbers from your class histogram in your line of the W2D2 Report Spreadsheet in clumns E-AF. Note that the numbers in line 8, columns E-AF, are the angles in the center of each 20 degree bin.
- Be sure to record your dataset in column D.
- Take a look at (but do not edit or interfere with) the plots at the bottom of the page in the spreadsheet (scroll down to line 158). Discuss results you see in class or in your group. Prepare questions for your videoconference.
- Connect to the videooonference via Vidyo at the World Wide Data Day 2019 Indico page.
Images
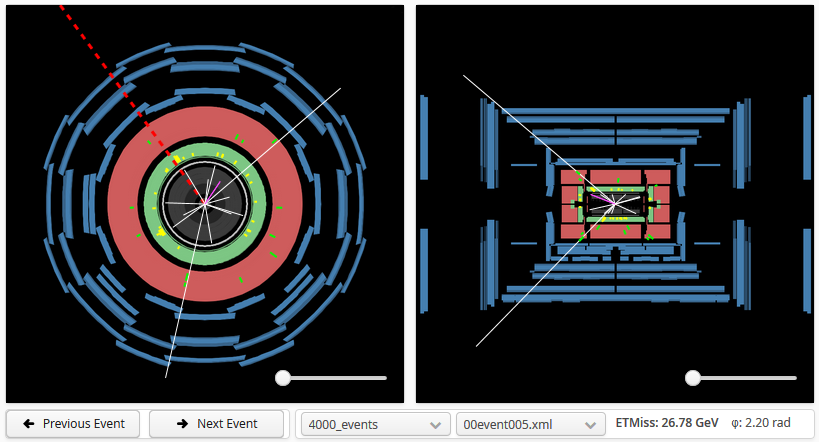
Dimuon event in HYPATIA online: forward (x-y) view to the left and side (y-z) view to the right.
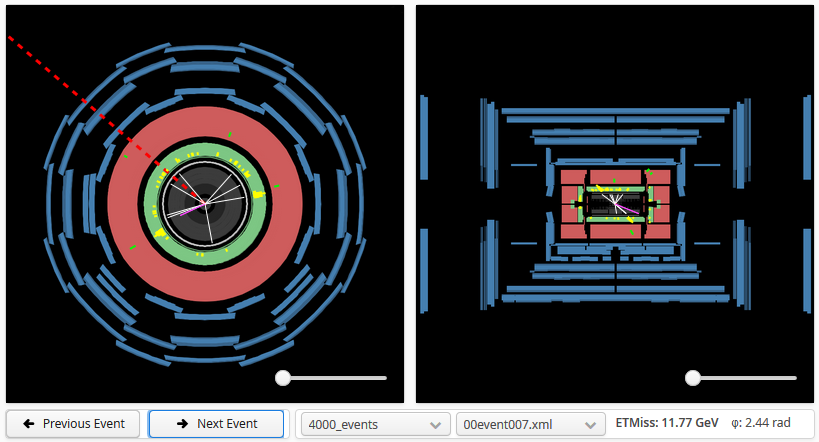
"Background" event in HYPATIA online: same x-y and z-y views.The long dashed red line in the x-y view of each event represents "ETMiss" (not a muon track) and can be ignored in this measurement.
Introduction
In this measurement, students find the directional distribution of muon track in CMS. They are searching for:
- anomalies in the distribution that might indicate a bias in the detector or in the data
- clues to how particles that result from collisions behave in CMS and the LHC.
Students should be divided into small groups. Each group should have a tally sheet. They should study the sheet before beginning.
Student Procedure
- Work with a partner teams of two are best for this measurement.
- Open iSpy-w2d2 and find the masterclass data. View the screencast for help.
- Choose the dataset assigned by your teacher. If you do not have a teacher or a physicist working with you, e-mail us for assistance choosing a dataset - the sooner the better.
- Advance through the events, only stopping for dimuons. Dimuon events have two long tracks that pass into to blue muon chambers in one or both of the two views. All else is treated as background.
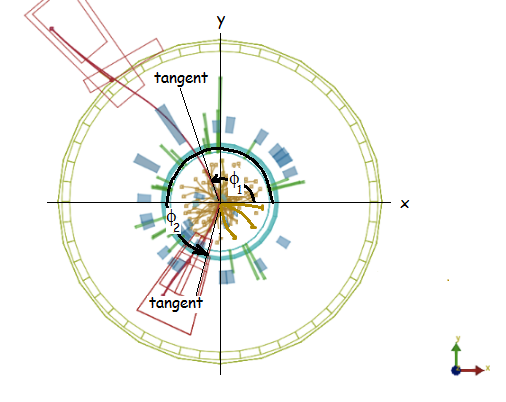
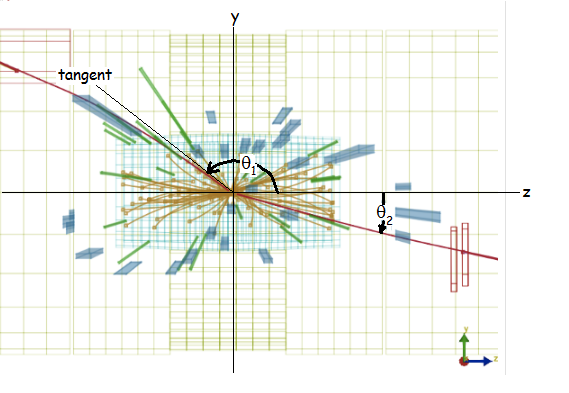
- For each dimuon event, look at each muon track in the forward (x-y) view on the left and measure angle PHI from the +x axis. The x- and y-axes should appear in this view. PHI runs all the way around the beamline (z axis) from 0 to 360 degrees. Then switch to the side (y-z) view, The z- and y-axes should appear. Start at the +z axis on the right and measure angle THETA for each muon track. THETA runs from 0 to 180 degrees either clockwise or anti-clockwise from the +z axis, whichever is the shortest path to the track. Note that you will need a protractor to make the measurement and that you should be careful to measure the angle in x-y from the tangent to the curvature of the track closest to the vertex or center of the event. (There is another way but it requires some manipulation and calculation.)
- Place tick marks for each angle measured in the tally sheet, using the closest values that appear in the sheet. (For example, 17 degrees is closest to 10 and 23 degrees is closest to 30.) This will allow us to record numbers of events in bins representing 20 degree intervals.
- When you are finished with your dataset, add up the number of tick marks in each bin of PHI and each bin of THETA and make a histogram of each on the second page (or reverse side) of your tally sheet sheet,
- Prepare to report your results to the class.
Teacher Procedure:
- Before you start, Open the W2D2 Report (Google) Spreadsheet and go to the CMS tab. Read the warnings!
- Look at the datasets other school groups have already selected for their measurements in column D. While some overlpa may be inevitable, try to select datasets for your students that are as little used as possible.
- Help students as they work from the Student Procedure above.
- As they finish, they should add their numbers to classroom histograms of PHI and THETA.
- Record the same final numbers from your class histogram in your line of the W2D2 Report Spreadsheet in clumns E-AF. Note that the numbers in line 8, columns E-AF, are the angles in the center of each 20 degree bin.
- Be sure to record your dataset in column D.
- Take a look at (but do not edit or interfere with) the plots at the bottom of the page in the spreadsheet (scroll down to line 158). Discuss results you see in class or in your group. Prepare questions for your videoconference.
- Connect to the videooonference via Vidyo at the World Wide Data Day 2019 Indico page.
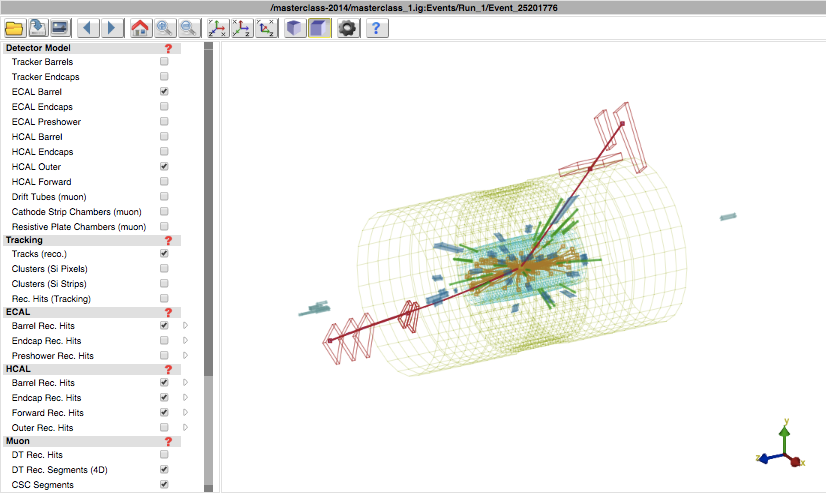
Images:
Choose the image to enlarge:
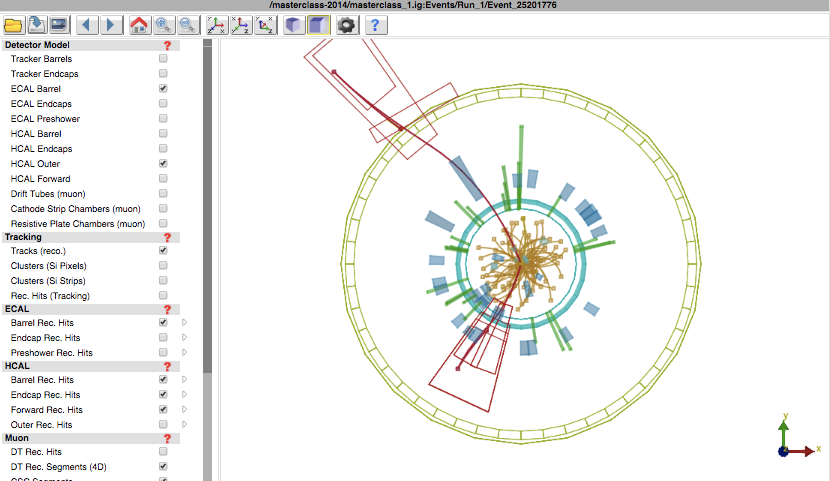
Same event in forward (x-y) view.
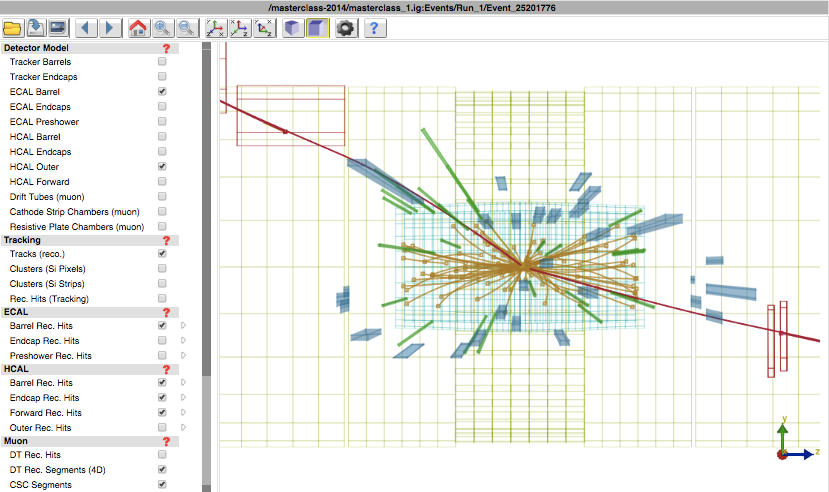
Same event in side (z-y) view.
Finding angle Φ for the upper muon in the x-y view.
Finding angles θ1 for the upper muon and θ2 for the lower muon in the z-y view.
 16 October 2019
Page Navigation: Notes Vidyo Tests Schedule Plan Questions
To participate in a videoconference, a group must register and be scheduled. Registration is now closed. To request an exception, contact the coordinator directly.
Notes and Instructions:
- Videoconferences will use Vidyo. For instructions on how to use Vidyo, please go to the Masterclass Library Vidyo page.
- Videoconference connections will be made using the link from the World Wide Data Day Indico page.
- Students do not need to report results in the videoconference. Rather, they should prepare short comments on how the measurement went, any surpises they found, or questions they have about the measurement. This short (~2 min) report is followed by moderators comments on the results so far and a Q&A. Please see the Videoconference Plan below.
- Prior to the videoconference, the teacher should help the students prepare questions and comments indicated in item 3 above. The teacher or a designee should also connect 5 min early to the videoconference to deal with any potential problems with the connection.
Vidyo Tests
Each participating group must have a Vidyo test to ensure a good connection on World Wide Data Day. The quality of the connection is critical to the success of the videoconference, which is the forum in which students connect with physicists and encounter the combined results.
Vidyo Test Procedure:
- No need to sign up. Just "show up" at one of the dates and time slots below. (Note: the test takes only 10-15 min; you can join Vidyo anytime during the time slot.)
- Set up for your test, using the same device, the same room, and the same internet connection you will use on World Wide Data Day.
- On the day of your test and sometime in your time slot, go to the World Wide Data Day 2019 Indico page, choose the Join button and follow the instructions.
For more detailed instructions on Vidyo, see the Masterclass Library Vidyo page.
Here is the current schedule:
- Tue 08 Oct, 13:00-14:30 UTC and 17:00-19:00 UTC
- Wed 09 Oct, 12:00-14:30 UTC and 18:30-20:00 UTC
- Thu 10 Oct, 12:00-16:00 UTC and 22:00-23:30 UTC
- Fri 11 Oct, 02:00-03:00 UTC and 14:00-16:00 UTC
To convert UTC to your local time, please use a good online Time Zone Converter.
Schedule of Videoconferences:
Unless otherwise noted. all videoconferences are via the Vidyo connection at the World Wide Data Day Indico page. This schedule is subject to modification.
| Time (UTC) | ATLAS Institutes | CMS Institutes | Moderators | Staff |
|---|---|---|---|---|
| 07:00-07:30 | Svishtov A, Singapore | Gozzelino | Cecire | |
| 08:00-08:30 | Castiglione di Stiviere, Hérouville Saint Clair* | Abreu | Cecire | |
| 08:30-09:00 | Msila, Tehran* | Abreu | Cecire | |
| 10:30-11:00 | Privas* | Kozloduy, Dupnitsa, Sofia | Abreu | Cecire |
| 11:00-11:30 | Reggio di Calabria*, Bakewell, Cosenza, Baltar | Junk | Cecire | |
| 11:30-12:00 | Ramnes, Vibo Valentia, Cluj Napoca | Espinosa | Cecire | |
| 12:00-12:30 | Porto, Benha*, Svishtov B, Ruse | Yu | Cecire | |
| 12:30-13:00 | Calheta, Lusby | Espinosa | Cecire | |
| 13:00-13:30 | Split, Moimenta da Beira, Shoreview | Gozzelino | Cecire | |
| 14:30-15:00 | Amarillo, Amman, Santiago de Chile*, Úbeda A, Funchal | Assamagan | Cecire, Wood | |
| 15:00-15:30 | Torino, Burnaby*, Caldas da Rainha* | Gozzelino | Cecire, Wood | |
| 16:00-16:30 | Lisboa* | Suarez | Wood | |
| 17:30-18:00 | Oxford* | |||
| 19:00-19:30 | Seattle | Suarez | Wood | |
| 19:30-20:00 | Canandaiuga* | Houston | Yu | Wood |
| 20:30-21:00 | OttawaKS*, Peniche | Yu | Wood | |
| 22:00-22:30 | Dallas* | Mexico City | Malik | Wood |
* Vidyo test or equivalent completed.
Make-up videoconferences:
- Mon 28 Oct, 00:30 UTC (Cecire) - Shanghai
- Mon 28 Oct, 12:30 UTC (Abreu, Cecire) - Manchester, Winamac, and Jerusalem
- Mon 28 Oct, 16:45 UTC (Abreu, Cecire) - Medford
- Wed 13 Nov, 11:00 UTC (Malik, Cecire) - Amman.
Videoconference Plan:
| Part | Time* | Activity |
|---|---|---|
| 0 | 5 min prior to start | Test connections, address problems |
| 1 | START | Introductions and Greetings |
| 2 | 5 min after start | Student comments and questions on measurement |
| 3 | 10 min after start | Moderators discuss overall results |
| 4 | 15 min after start | Q&A |
| 5 | 30 min after start | end |
* Times are flexible (except start) and not all videoconferences will take the full 30 minutes.
Questions? Contact us!
World Wide Data Day is 16 October 2019. Registration is due 9 October 2019.
Register your group for World Wide Data Day!
Notes and Instructions:
- World Wide Data Day 2019 will be held from 00:00 to 23:59 UTC on 16th October 2019. When you convert to your local time zone, some of this interval may fall on the previous or the next date, depending on your location and the time.
- You may convert times at https://www.timeanddate.com/worldclock/converter.html.
- Registration should be done by the leader of your W2D2 team. Usually, this is the teacher in a school.
- Please note that the first 6 items in the Registration form are required.
- Student videoconferences with moderators are up to 30 minutes long. Times are assigned in advance via the registration form link below. You will be able to choose a 2 hour time slot and your 30-minute videoconference will be assigned within that slot. Make sure you convert between UTC and your own time zone!
- If you have more than one group or wish more than one videoconference, please submit separate registrations for each.


