This document in PDF form: http://tiny.cc/cms-doc-imc19.
External Links:
CMS Enhanced WZH Measurement
Created by K. Cecire, T. McCauley, Joel Griffith, QuarkNet LHC fellows
The CMS Enhanced measurement is supported for International Masterclasses.
Languages supported: Chinese, Dutch, English, French, German, Hebrew, Hungarian, Italian, Japanese, Polish, Portuguese, Russian, Spanish, Turkish
Contents:
- Description
- Requirements for hardware and software
- Outline of the day
- Student procedure
- Presentation of results
- Sample questions
- Moderators
- Material for students and teachers
- Low/No Bandwidth Supplement
Students make visual obeservations of and measure events with 1, 2, or 4 visible leptons in the iSpy event display.
Events with one visible lepton plus missing Et are presumed to be from decays of W bosons. Students measure the curvature of the visible lepton to determine whether the W is a W+ or a W- and record in the online CMS Instrument for Masterclass Analysis (CIMA). CIMA compiles statistics across the whole masterclass to find a ration of W+ to W- candidate events. Students also count the number of electrons and the number of muons in these events. Tau particles are not seen in this measurement. Note that "electrons" refers to both electrons and positrons; "muons" refers to both muons and antimuons.
Events with two visible leptons are presumed to be from Z bosons but can actually come from other particles which decay into dipleptons, in particular, J/Psi and Upsilon mesons. Students the "shift-click" function in iSpy to determine the mass of the parent particle of the two leptons. They also, as before, count electrons and muons.
Events with four visible muons are presumed to be from two Z bosons, one of which may or may not be off-shell. It is also possible for some of these events to come from a single Z which has radiated a photon and then decayed into two leptons; the photon pair produces into two leptons. Students find the mass of the partent particle of the four-lepton event using the "shift-click" option in iSpy. Again, students count the number of electrons and muons.
Students will reports all results in CIMA, including counts of W+, W-, electron, muon and mass of parent particle. If events do not fit into any of these paterns they are reported in the "Zoo" category. CIMA creates ratios of W+ and W- as well as electron to muon from the statistics. CIMA makes two mass histograms from the mass data: one for two-lepton events and one for four lepton events.
Students and physicists discuss the ratios and their meanings. They also find not only the Z peak but also J/Psi and Upsilon peaks in the two-lepton massplot and Z-gamma and ZZ peaks, as well as a possible H → ZZ* peak in the four-lepton plot.
Datasets: Each dataset contains ig files, readable in iSpy, for 100 events. Two students normally work together on a single dataset. There are five classes of datasets, depending on the number datasets N used for an expected number of students 2N in the masterclass. Each class has a mix of single visible lepton (W candidate) events, dilepton events, and Zoo events, including a few possible diphotons. The 276 four-lepton events are mixed into the datsets according th class:
- Very Large (2N~200) - 276 four-lepton events spread over 100 datasets
- Large (2N~100) - 276 four-lepton events spread over 50 datasets
- Medium (2N~50) - 276 four-lepton events spread over 25 datasets
- Small (2N~20) - 276 four-lepton events spread over 10 datasets
- Very Small (2N~10) - 276 four-lepton events spread over 5 datasets.
Requirements
for hardware and software.
Online:
- Reliable, high-speed internet connection
- Up-to-date version of Firefox, Chrome, or Safari
Offline:
- Masterclass DVD
- A browser that supports the FileReader API: Firefox 3.6+, Chrome 6+, IE 10+, Safari 6+, Opera 11.5+
- Spreadsheet (e.g. MS Excel, OpenOffice) may be needed
- Work out a system for data transfer from student level to institute level and then for transmission of results to moderators
- Note: Moderators cannot show institute mass plot results in the videoconference. The mentor should share the institute mass plot through shared desktop. (In the Fermilab-based masterclass, there is an Indico page for the videoconference and the mentor can upload material such as a mass plot by means of a modification key.)
Outline of the day
This is not a final schedule but an outline for most U.S. institutes.
- Arrival/Registration (~30 min)
- Cloud chamber, e/m apparatus, or other "gateway experience" apparatus setup for students to inspect
- Start and Ice-breaker activity (~30 min)
- Students in small groups create 1-2 good questions about particle physics and/or LHC. Where practical, groups should be made of students from different schools.
- Mentor presentation
- Template (~60 min, including Q&A)
- Tour of facilities/labs/cool stuff (~45 min)
- Analysis preparation (1-2 teachers facilitate; ~60 min, including Q&A)
- Presentation (template)
- CMS data analysis slides (2017 version)
- Guided practice with discussion
- Lunch with a physicist (~60 min)
- Data Analysis (~90 min)
- Pre-conference (~30 min)
- Students and mentor discuss meaning of analysis results.
- Students and mentor discuss questions for other institutes.
- Revisit questions from ice-breaker, discuss which to ask in video conference.
- Designated IT expert preps video connection.
- Videoconference (~30 min)
- Greetings
- Presentation of results
- Discussion of results
- Q&A
- Summing up and evaluation (~15 min)
Student tasks:
- Each pair of students analyzes a set of 100 events
- For each event, distinguish between electron and muon decay and between
- W+ or W- candidate (recorded as "W" if charge cannot be determined),
- NP (Z or other "neutral particle" candidate),
- Higgs candidate,
- and zoo event (unusual and cannot be characterized).
- Record into CIMA.
- Be prepared to discuss in Masterclass Institute and in videoconference; prepare good questions.
Student procedure
It is important to carefully note the following:
- Mentors and tutors need to be familiar with CIMA in order to guide the students successfully.
- The description below is for the current event display, iSpy-webgl. which works for both online and offline masterclasses. This version is recommended for the WZH-path masterclasses used in International Masterclasses.
- The older iSpy-online is still recommended for the J/Psi-path masterclass and as a back-up for the WZH-path.
Mentors should guide students to follow these procedures for the use of iSpy and CIMA:
Screencast: https://www.screencast.com/t/SLQyyXy8.
- Pairs of students are assigned sets of 100 events to analyze in iSpy-online or iSpy-dvd.
- Event sets are found in the iSpy-webgl by choosing the folder icon (top left).
- A first window appears. If the data is to be taken from the internet, choose "Open file(s) from web" in this window. If the data is offline, choose the button under "Open local file(s)" and navigate to the file. Either way, a second window will open.
- In the second window, students first choose their event set (labeled masterclass_1, masterclass_2, etc.). The entire set of 100 events will then load into the browser. This may take some time.
- After the set of 100 events is loaded, a list of events in that set will appear on the left side of the window. The student chooses the first of these events and then the "load" button. This will open the first event.
- Students also open CIMA and then find their masterclass by date ("Choose your Masterclass") and then institute ("Choose your location"). They then choose the number of their event set ("Choose your group"): this is the same number as the event set in iSpy.
- Notes on CIMA for students:
- All institutes are strongly encouraged to use CIMA rather than a local spreadsheet, found at https://www.i2u2.org/elab/cms/cima/index.php.
- CIMA will have your date and your institute to choose from and will be at the URL for the masterclass videoconference inn which you will participate. If needed, Google spreadsheets will be provided online in case of any problems with CIMA.
- CIMA is also linked at the CMS Library page at /content/cms-wzh-path-measurement-2018 (scroll down to Data Analysis).
Find the correct data files in iSpy and CIMA:
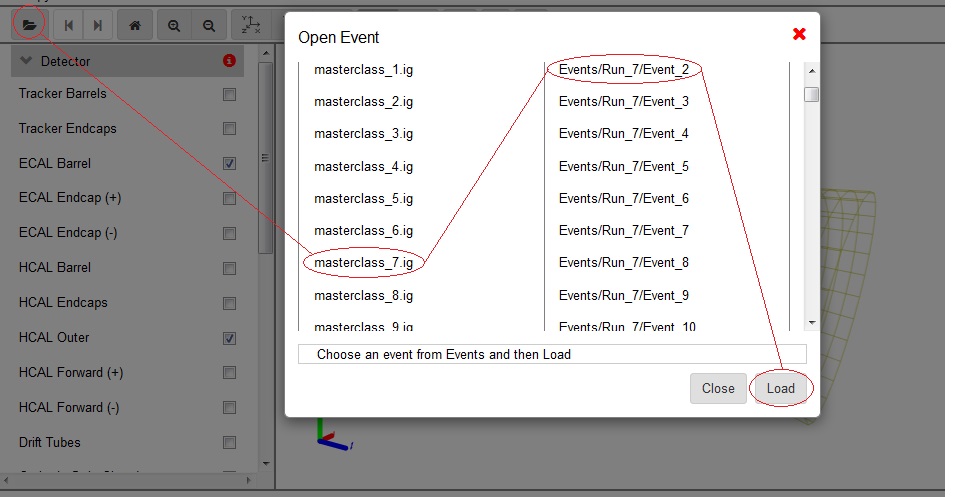
Open iSpy-webgl event display. To find the correct dataset, choose the file folder icon at the top left the choose
events from the web or locally; when the "Open Event" box appears, find your dataset, choose the first event, and
then choose the "Load" button.
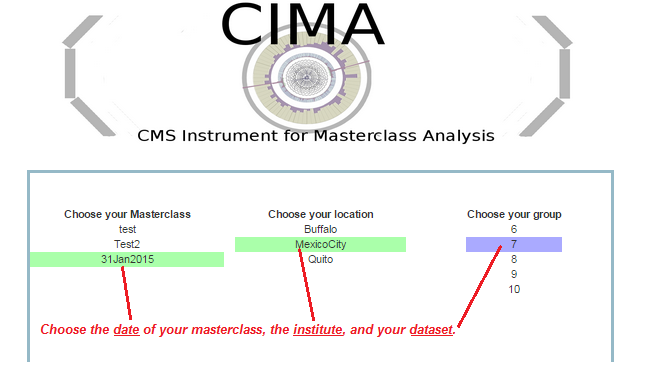
Open CIMA and find your dataset. First choose the date and then the location list appears. Choose your institute
and then your set of events.
Students use event display of (mostly) leptonic decays to determine
- Final state lepton ID (electron, muon). This is to characterize the event, not individual particles.
- If the event has one muon track (long, red) or two muon tracks (actually likely a muon-antimuon pair) it is a single muon event.
- If the event has one electron track (short, green) or two electron tracks (actually likely an electron-positron pair) is is a single electron event.
- Likely particle ID (W, NP, zoo, Higgs)
- W candidate appears as a single electron track or muon track and a missing Et vector (dashed purplish/pinkish track, transverse to beamline)
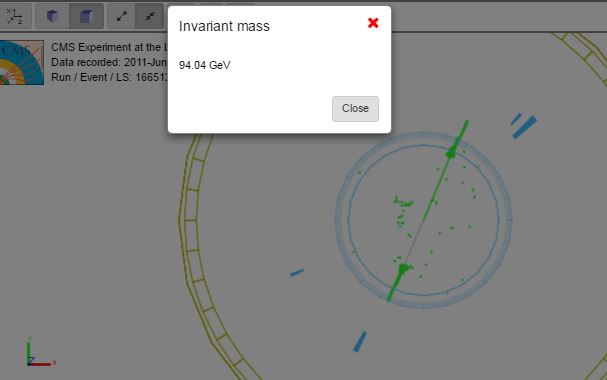
- NP in CIMA refers to Z or other neutral particle candidate which decays into 2 final state muons or 2 final state electrons. It may or may not have some missing Et in the event. If a student finds an NP candidate in iSpy-webgl, they must shift-click on each of the 2 lepton tracks to get a calculated invariant mass of the parent neutral particle.
- Some events will have multiple lepton tracks plus missing Et. The student can choose a track with the cursor and a window will appear with track information. The most important of these is transverse momentum, pt. This can be used to distinguish which tracks are important and which are low-energy background.
- Suspected Higgs (H); these are rare but noteworthy. Events show as
- H→ZZ: 2 electrons and 2 muons, or 4 electrons, or 4 muons.
- H→γγ: no electron tracks but 2 large energy deposits (seen as towers) in ECAL.
- Zoo events are "none of the above" but there can be interesting events among these.
- Charge if W, using curvature of electron or muon tracks. It helps to select the X-Y view and "orthographic mode" (the "flat cube" button), zoom in and to use a paper straight edge.
- Mass of Higgs candidate (taken from CIMA)
- Mass of the NP candidate from iSpy-webgl and transferred into CIMA.
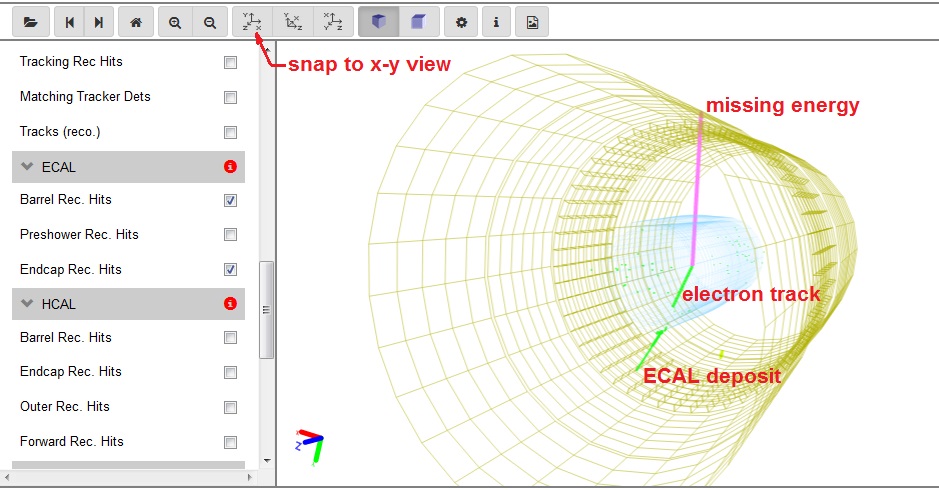
Adjust event settings to get x-y view for track curvature in case of W candidates.
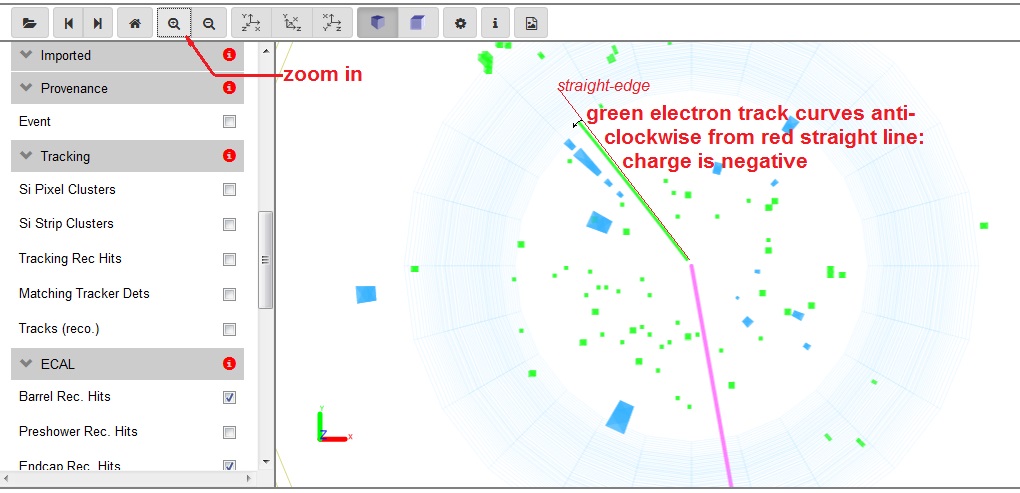
Candidate W- → e- + anti-νe.
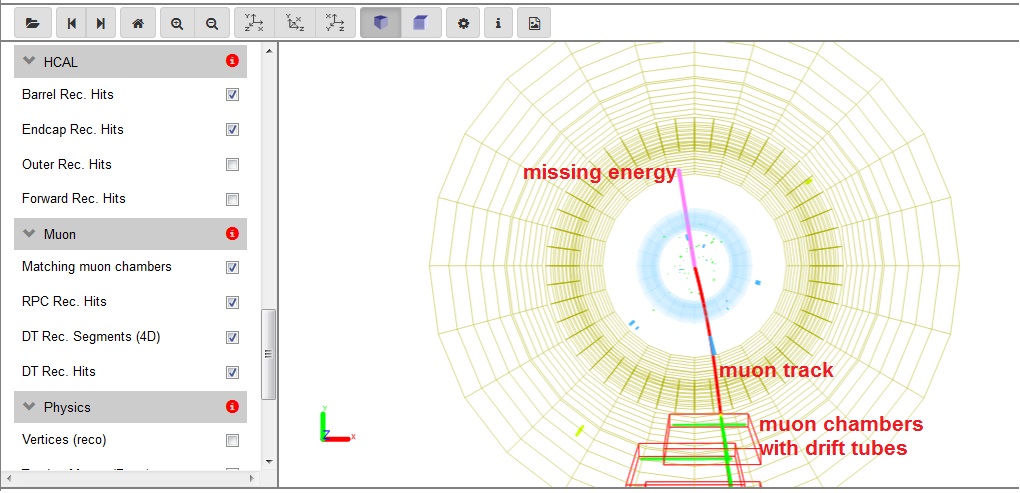
Candidate W+ → μ+ + νμ.
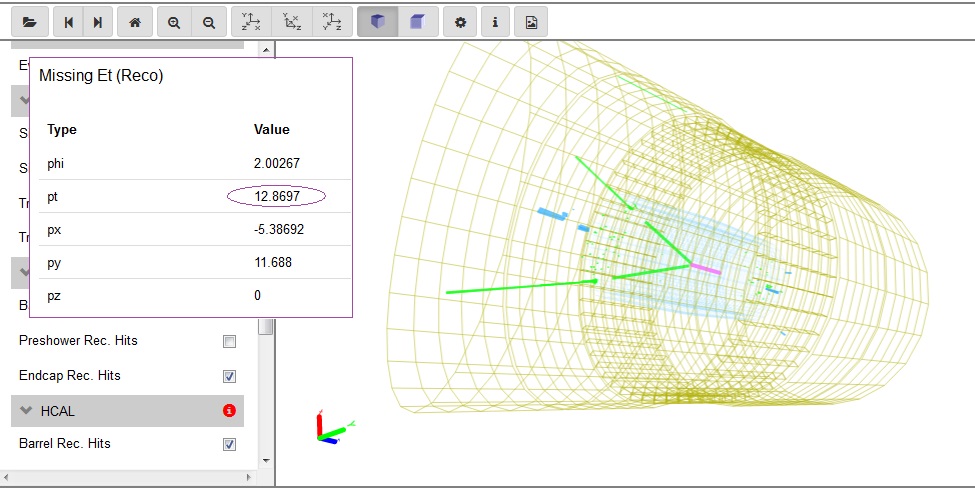
Candidate Z → e+ + e- . Note the low value of missing Et, found by choosing the missing energy track. This gives
some confidence that this is not a W event plus an aditional electron.
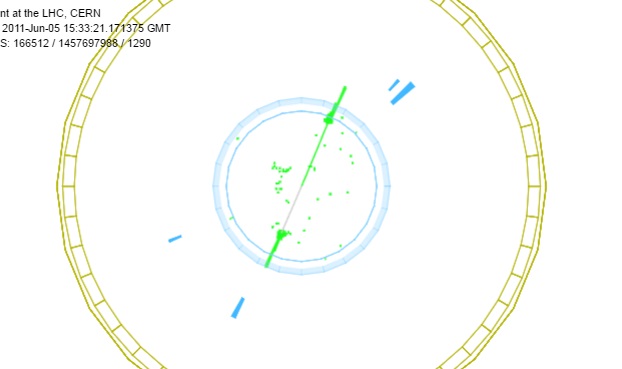
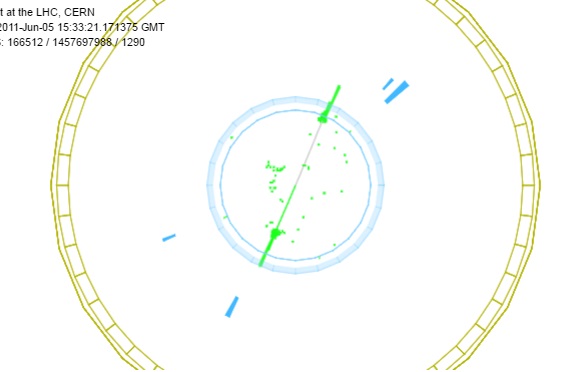
Illustration of finding invariant mass of an NP candidate:
|
1.
|
2.
|
3.
|
| Hover over one track until it turns gray. Press Shift and click. (Note track at about 7 o'clock.) | Do the same for the other track. (Note track at about 1 o'clock.) | A window with the invariant mass appears. Transfer this to CIMA. |
After a pair of students has found their "group" or dataset in CIMA, they will be sent to their Events Table. They will see checkboxes at the top to characterize each event. They should look at the corresponding event in iSpy-webgl (they can check the event numbers to be sure they do correspond) and determine which sort of event it is, following a few rules:
- Choose whether it is an electron or muon event under "final state".
- If the event is a Higgs or zoo candidate (under "special"), no final state is chosen.
- Choose the most likely parent particle under "primary".
- If it is a Higgs candidate (diphoton or 4-lepton), a mass will appear.
- If it is NP (Z or other neutral particle), type the mass in GeV into the NP mass box.
- If it is a W or zoo, no mass will appear as we do not include these in the mass plot. If a W and a charge can be determined, choose either W+ or W-. Only choose W without a sign if the lepton track is so straight that a probable charge cannot be determined..
- Choose the Submit button. This puts the data below in a line corresponding to the Event Index number.
- In the case of an error, double-clicking the data line will erase it; you can then try it again.
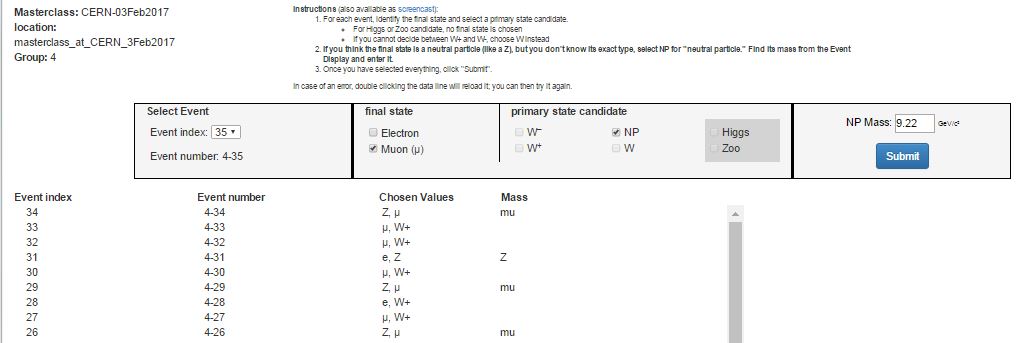
Sample data entered into CIMA. These entries were made randomly and do not show any preferred results.
Note the mass typed into the NP Mass box. This number would have been generated in iSpy-webgl.
- When a mass is shown in the line for an event, the students should record it in the Mass Histogram. The student should:
- Choose "Mass Histogram" at the top.
- Zoom to get a good size for the massplot, if needed, using ctrl-minus (PC) or cmd-minus (Mac).
- The numbers on the horizontal axis are the values of the middle of the bins of width 2 GeV. Select the bin by clicking. This will iterate the massplot up by one for that mass.
- To remove an errant mass iteration, use ctrl-click (PC) or cmd-click (Mac) on the same number.
- Important note: The Mass Histogram is attached to all groups in the same location. Thus when a student adds to or deletes from the Mass Histogram,the student is doing this for everyone at the masterclass institute. Thus students will see the Mass Histogram seem to change by itself. This is the normal result of other students working on it.
- The total of number of events at each mass is then automatically transferred to the mass plot in the Results tab.
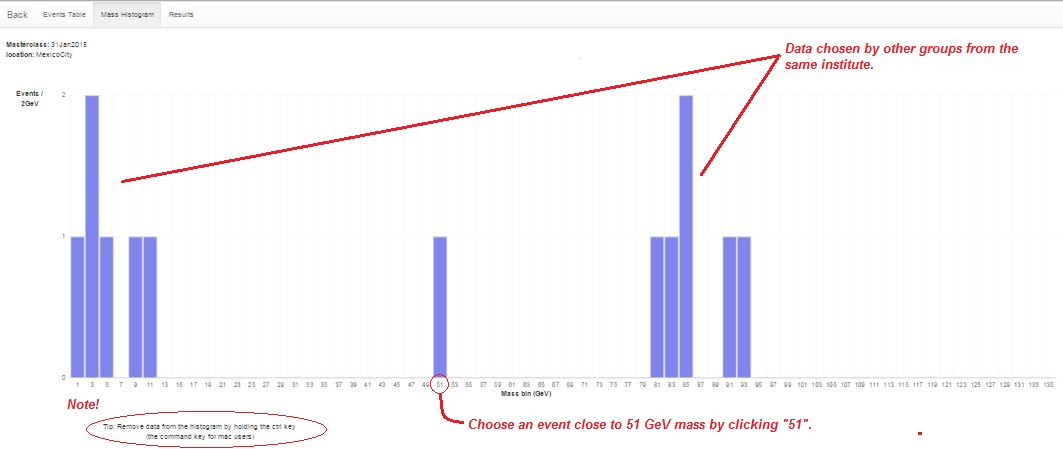
Enter masses the Mass Histogram for the entire institute (location). Refreshing will show any newly added masses.
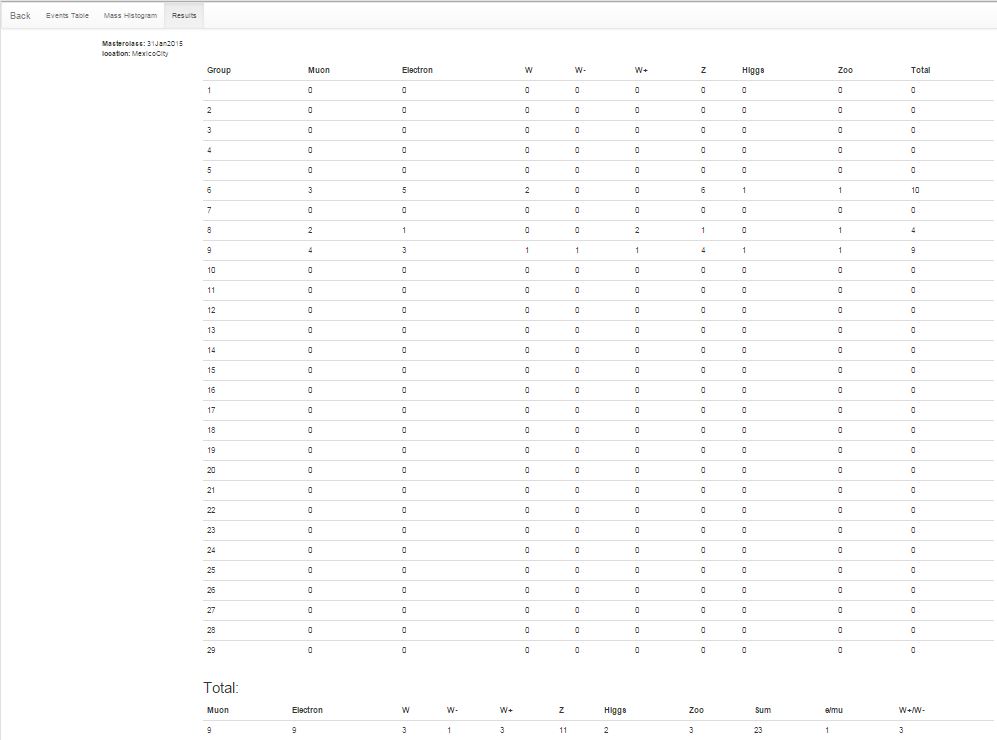
Numerical results can be seen in the Results page for the institute (location).
Presentation of results
The mass plot and summary of results are automatically built in the institute (location) Mass Histogram and Results pages. The mass plot will show not only a Z peak but also peaks due to other particles. The results will show the numbers of electron, muon, W+, W-, W (unknown charge), Z cand, H cand, and zoo events plus the key ratios e:mu and W+:W-. The mentor should project the mass plot and the count/ratio results and discuss their signficance with students. The mentor should also help the students to generate questions for the videoconference or other later discussion.
For Fermilab-based videoconferences, the mentor should show the students the Mass Histogram and Results for another institute. Each institute is assigned another one to which they may ask one or two questions. In our example, Buffalo may ask questions of Mexico City and Mexico City may ask questions of Quito, etc.
Sample questions
In discussion, the moderator might ask students
- How many peaks are there in the mass plot?
- Where is the Z peak? What is the mass of the Z boson?
- What do the other peaks mean?
- How many Higgs candidates did you find? Can we guess its mass? Describe its decays.
- What is the ratio of electrons to muons? Is it close to what we should expect?
- What is the W+:W- ratio? What should it be?
In the videoconference, students might ask questions like
- Why are the widths or heights or numbers of peaks different from one Institute to the next?
- Why do different Institutes get different ratios? How did they identify electrons or muons or W candidates or Z candidates or zoo events? How did they measure charge for W candidates?
- Now that the Tevatron is shut down, what do you do at Fermilab?
- Is it boring at CERN when the LHC is not running?
- Why did you become a physicist?
...and better questions which only students can create.
Moderators
Fermilab-based moderators should refer to the FNAL Masterclass 2017 Moderators page.
All moderators should note the following:
As long as all groups use CIMA, moderators do not need to look for uploads from any of the masterclass institutes or make histograms on their own. There is one "Table" for each masterclass institute (location) participating in a single videconference. Each institute has a Mass Histrogram and a Results page.
- Mass Histogram - students use "Events Tables" to record W or Z candidates, e or µ events, Higgs candidates, and "zoo" events. Choosing Z or Higgs candidates results in masses popping up, which students transfer into the Mass Histogram.
- Results - numbers of different types of particles are automatically transferred here; e:µ and W+:W- are calculated for the whole institute.
The moderators will access the Admin page of CIMA to view these and share them on Vidyo. They will also view and share the combined Mass Histogram and combined Results for all institutes participating in their videoconference.
To get to the appropriate places, moderators only should go to the CIMA Admin page.
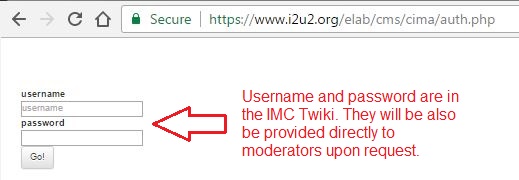
Then:
- Log in. The user name and password will be sent separately.
- Please do not touch anything above Manage Tables.
- Go to the part of the page under the Manage Tables heading.
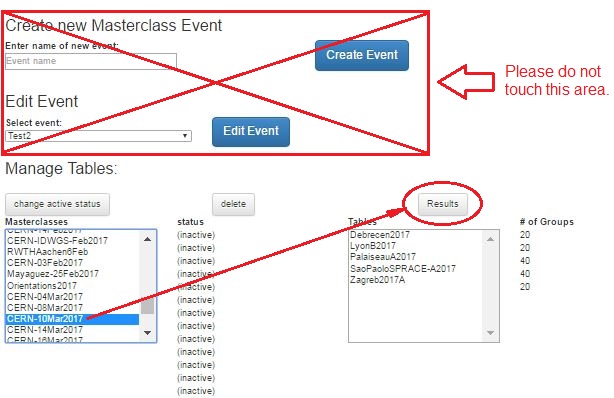
CIMA Admin page. This shows how to choose results for 10 March.
You are now on the Results tab for combined results for all institutes in the videoconference. To choose results for a particular institute (and you should do this for each one), go to the small down arrow next to All at the top to get a pull-down for all institutes and for each individual institue. Choose Mass Histogram to switch the the mass plots.
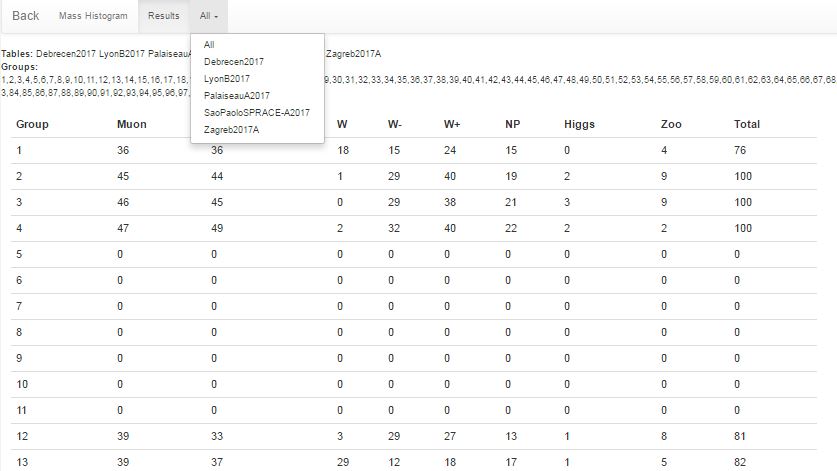
Pull-down menu for Results or Mass Histogram for each institute or all institutes.
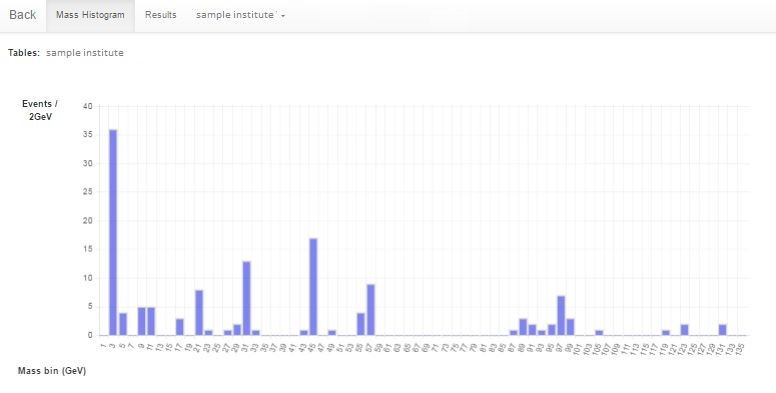
Mass plot for one institute.
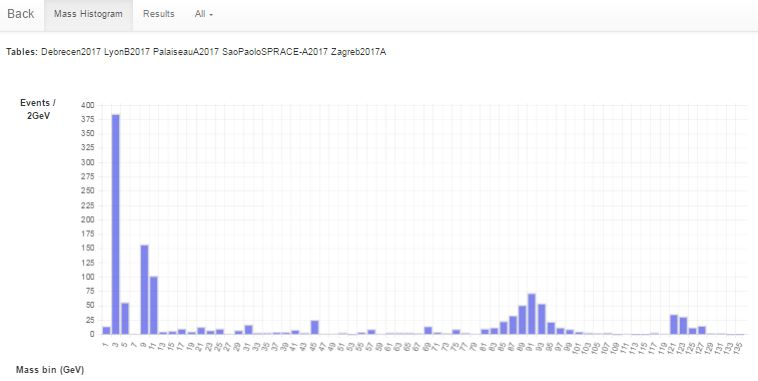
Combined mass plot for all institutes.
Moderators should discuss the results from each institute and the overall results with the students, making sure to stay within time constraints. If an institute does not use the online spreadsheet, the mentor for that institute should show their mass plot and results using Vidyo desktop sharing.
Material
for students and teachers:
- Classroom prep activities
- Rolling with Rutherford at /data-portfolio/activity/rolling-rutherford
- Quark workbench at /data-portfolio/activity/quark-workbench
- Calculate the mass of the top quark from Tevatron data at /data-portfolio/activity/calculate-top-quark-mass
- Calculate the mass of the Z boson from LHC data at /data-portfolio/activity/calculate-z-mass
- Aid in masterclass
- Analysis presentation at /sites/default/files/cmsanalysis2016_v0.ppt
- CMS Masterclass "Cheat Sheet" at /sites/default/files/cmscheat_wzh16_v0.pdf
- Student webcast on using iSpy-webgl: View on YouTube.
- iSpy/CIMA webcast: View on screencast.com.
Low/No Bandwidth Supplement
In the case where bandwidth or connection to CIMA is a problem, please use these alternative steps:
- Download what you need:
- iSpy-webgl (zip file; works best in Firefox)
- Data (CMS doc-db page with ig files)
- README file (txt file with basic instructions)
- DVD (contains iSpy, data files, and README).
- Distribute the spreadsheet mc2016dvd_students to students. It is in the “more” folder of the DVD.
- Students should find their dataset in the Datasets tab. For each event they examine in iSpy-dvd, students should:
- place a “1” (and only a “1”) under electron or muon only if the event is a W- or Z-candidate.
- place a “1” (and only a “1”) under W+ cand, W- cand, W cand, or Z cand only if the event is a W- or Z-candidate.
- place a “1” (and only a “1”) under “zoo” if the event cannot be characterized.
- place a “1” (and only a “1”) under Higgs cand only if the event is a Higgs (diphoton or 4-lepton) candidate.
- If the student characterizes the event as a Z or Higgs candidate, a mass in GeV will appear in the rightmost column. The student should then go to the Results tab and place a “1” (and only a “1”) above the mass (rounded to the nearest odd number) in the cell directly above the mass in row 33. If this cell is filled, the student goes to the next one up. The student then returns to the Datasets tab and continues to work.
- Once the data analysis has stopped, the student should find the total numbers of electrons, muons, W+, and W- from the bottom of their dataset and write these down. They should also write down the total non-zero number of events for each mass (with the mass) from the Resutls tabs. These numbers must be reported to the mentors. Students may use the Data Report Form found in the “more” folder of the DVD.
- A mentor or a teacher can then type in the totals in the mc2016dvd_mentors spreadsheet, found in the “more” folder of the DVD. The will create a combined e/μ, W+/W-, and mass plot for the whole institute.
The results cannot be combined with the other masterclass institutes in a videoconference but they can be shared via the Vidyo desktop. Upon request, a Google version of the mentors spreadsheet can be made to make entering data much quicker. Send an e-mail to kcecire@nd.edu for this.
